 Surfer
Getting Started Guide
Experience the Power of Surfer
Mastering a new software solution takes time. Learning the basics and generating your first map shouldn't. This guide is designed to introduce you to Surfer's powerful gridding and visualization features in approximately 15 minutes.
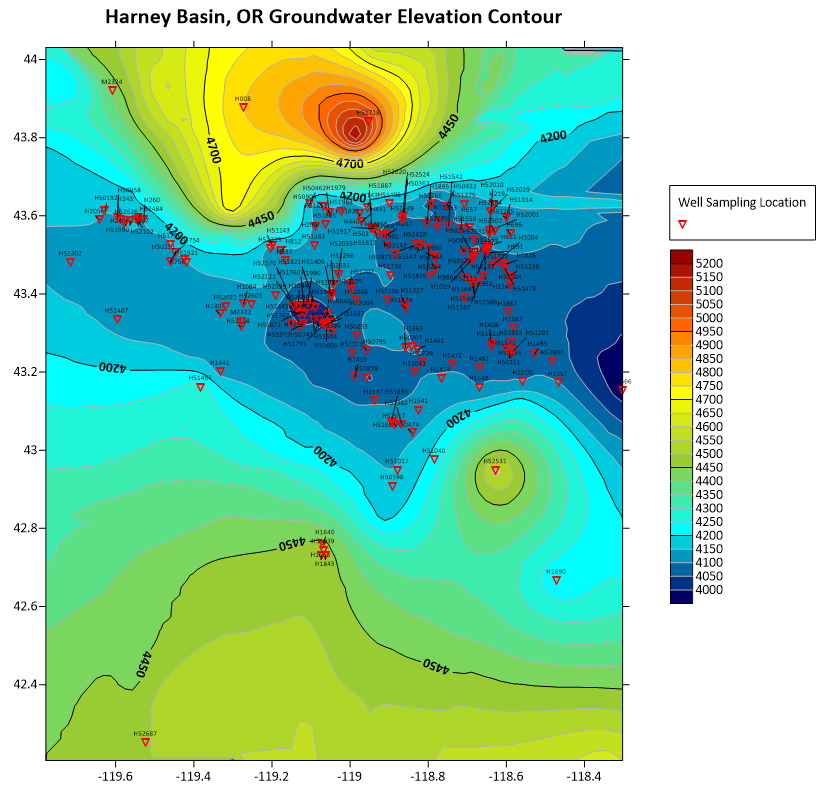
Your Surfer introduction begins by creating this groundwater elevation contour map. This type of map may also be used to represent a potentiometric surface or depth to water table.
After completing this guide, you will have the tools you need to create similar figures with your own data.
The final page contains resources to help you expand your understanding of Surfer and the impact Surfer can make in your work.
This guide covers the following topics:

Before we begin...
➡️ indicates an action you need to take.
➡️Let's get started!
- Download and extract the ZIP file containing the data used for this guide - Navigating Surfer_Sample Data.zip.
The files must be extracted from the ZIP after download to make them available to Surfer. - If you haven't already, please download and install Surfer.
A download link is provided in the email with subject line: [Surfer Trial] - Welcome friend, let's get you started! or you can download the software from our Software Downloads page. - Open Surfer by double clicking the Surfer icon on your desktop or by selecting it from the list of installed programs in the Windows Start menu.
Time to create our first map...