 Surfer
Getting Started Guide
Customizing Your Map
Time to go from unremarkable to stunning!
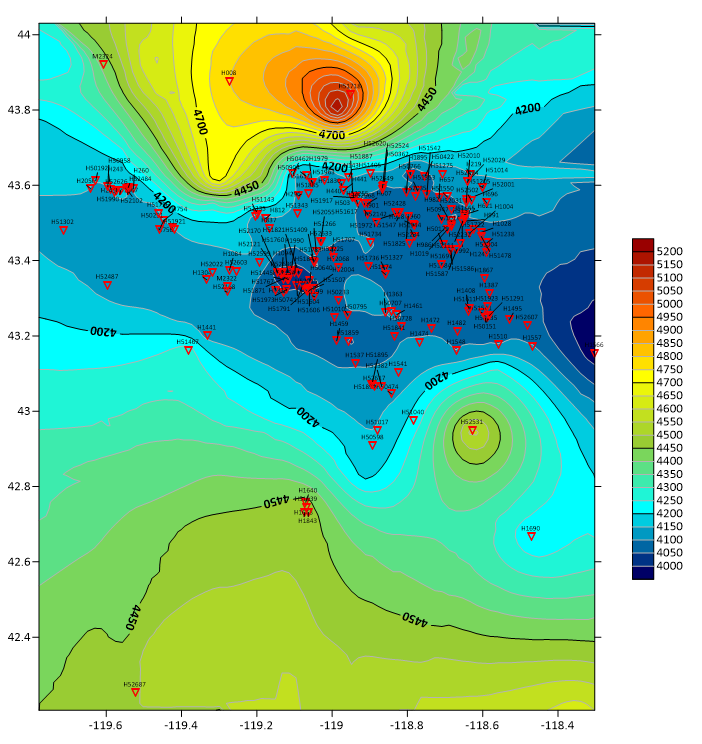
We now have a map with contour and post layers but they do not stand out. To make a compelling presentation with this map we need to customize it so that it is visually appealing and clear what the contours and post map symbols represent.

Contour Layer Customizations
The Properties window is used to customize every aspect of your map from the way each layer is displayed to the text formatting for custom labels.
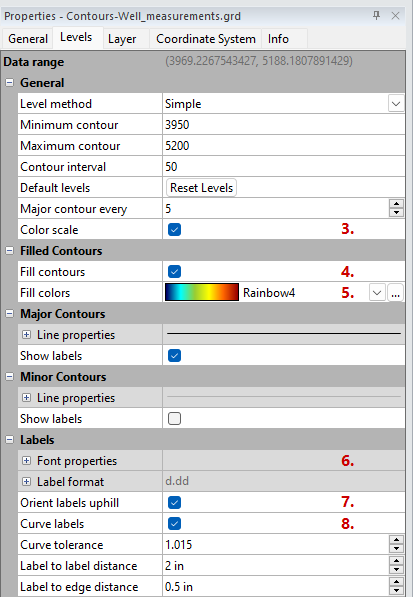
➡️ In this exercise, we are going to fill the contours with a rainbow fill pattern and add a color scale to inform the viewer what elevation is associated with each color.
- Click the Contours layer in the Contents window to select it.
- Click the Levels tab in the Properties window.
- Check the box next to Color scale.
- Check the box next to Fill contours.
- Click on GrayScale in the Fill colors field and select Rainbow4.
📢 Pro tip: You can customize or create your own color schemes with the Colormap Editor by clicking the ellipses (...) next to the Fill colors dropdown.
-
In the Labels section click the + next to Font properties to expand the options and check the box next to Bold.
- Check the box next to Orient labels uphill.
- Check the box next to Curve labels.
Post Layer Customizations
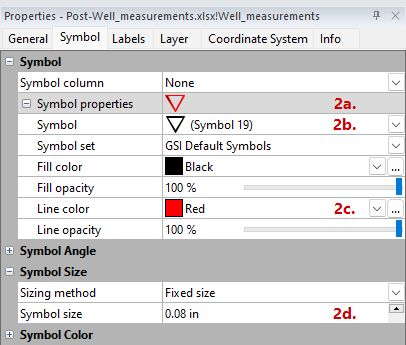
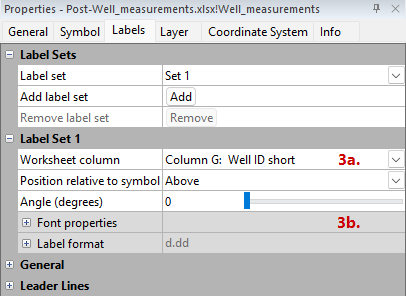
➡️ The post layer symbols are barely discernible as is so let's adjust the symbol properties and add labels to enable well identification.
-
Click the Post layer in the Contents window to select it.
-
On the Symbol tab in the Properties window:
-
Expand Symbol properties.
-
Click in the Symbol field and select Symbol 19 (open triangle pointing down).
-
Change the Line color to Red.
- Change the Symbol size to 0.08.
-
-
On the Labels tab in the Properties window:
-
Click in the Worksheet column field and select Column G: Well ID short
-
Click the + next to Font properties and decrease the Size (points) to 4
-
- Click Map Tools | Edit Layer | Disperse Labels
-
In the Disperse Overlapped Labels dialog, change the Maximum dispersion distance to 0.5 and click OK.
-
Click OK in the Surfer warning dialog.


