 Surfer
Getting Started Guide
Creating a Map
Surfer's Map Wizard makes it easier than ever to go from data to map in only a few minutes. The wizard can be used to create new maps, as we're doing in this exercise, and to add map layers to existing maps.
➡️ To create a map using the Wizard
- Open Surfer if it is not already open.
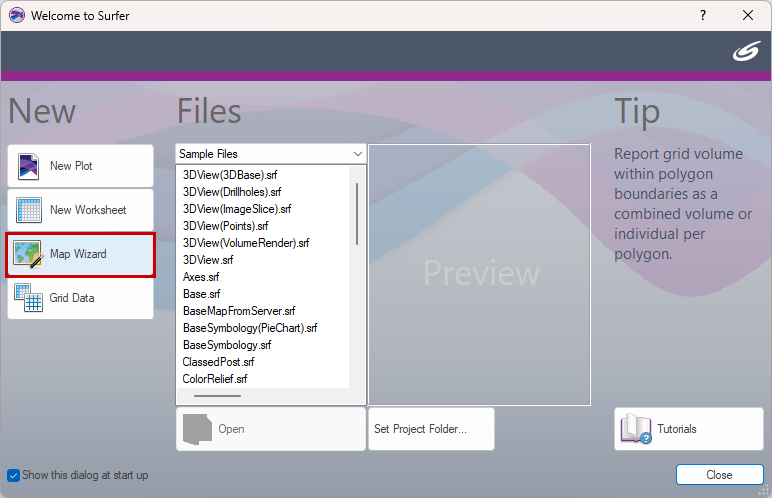
- Click Map Wizard in the Welcome to Surfer window.
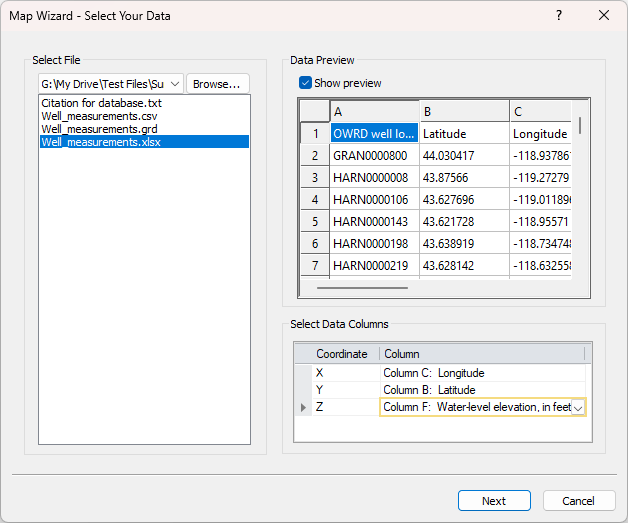
Map Wizard - Select Your Data
The Select Your Data page of the map wizard makes it easy to select data from the Sample files directory, your Project files directory or a list of Recent files by clicking the appropriate option from the dropdown. You can also browse all files on your computer to select the desired input dataset.
➡️ In this exercise, we'll use the browse option to select the downloaded dataset:
- Click Browse and select the downloaded Well_measurements.xlsx
- Click OK in the XLSX Import Options dialog.
- In the Select Data Columns section, set the data columns to
X = Column C: Longitude
Y = Column B: Latitude
Z = Column F: Water-level elevation, in feet
- Click Next.
Map Wizard - Select Your Map Type
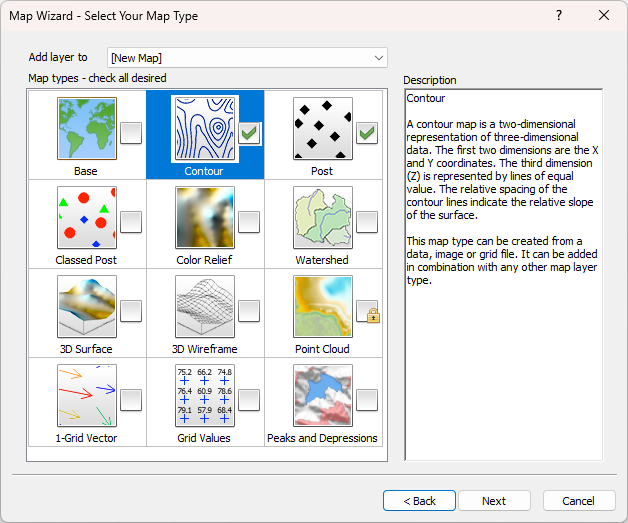
The Select Your Map Type page of the map wizard displays all available map types along with a description when each map type is selected. If a lock is displayed next to the map, that map type cannot be created with the selected file type.
➡️ In this exercise we are going to create a contour map of the water level elevations with a post layer displaying the well locations.
-
Check Contour and Post boxes in the list of available map types
-
Click Next.
Map Wizard - Select Gridding Parameters
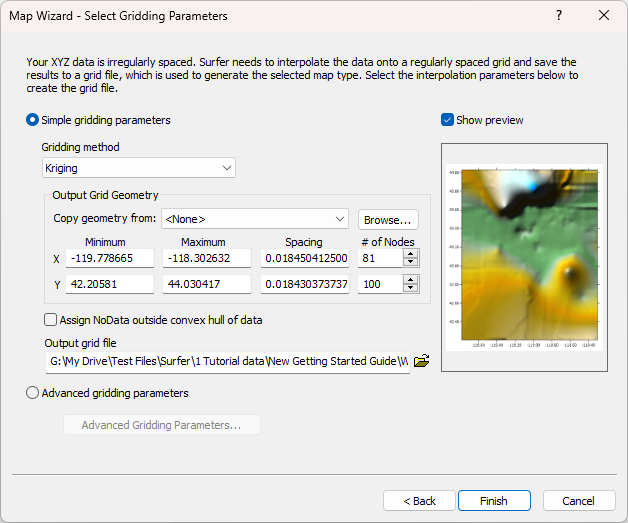
The Select Gridding Parameters page of the map wizard is displayed if one of the selected map types requires a grid file, and a grid file was not selected as the input file type.
On this page you can adjust the simple gridding parameters to create a grid based on default search and filter settings, or you can choose to apply advanced gridding parameters using the Grid Data dialog. Surfer's Grid Data dialog gives you full control of how your data is interpolated to create a surface grid.
➡️ In this exercise, we will use the default gridding parameters
- Verify your Gridding method is set to Kriging and click Finish to create the map.
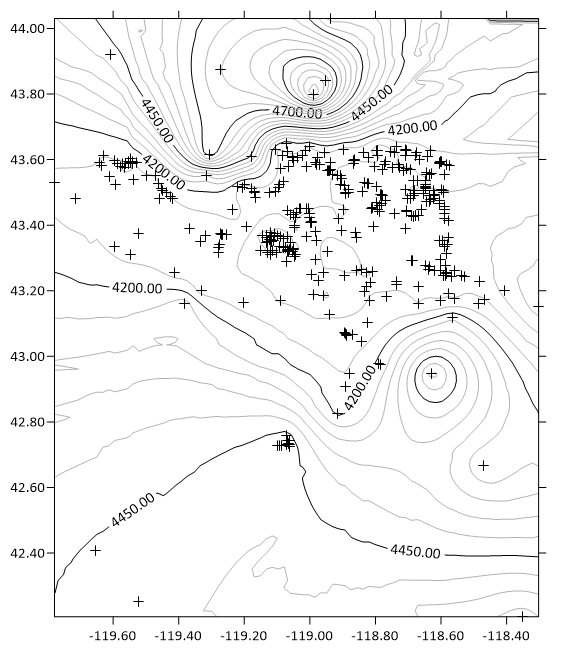
Now that we have a map of the groundwater elevations, let's make it tell a story by adding some color and context...