Webinar Recording
Create Interactive 3D Site Models with Surfer
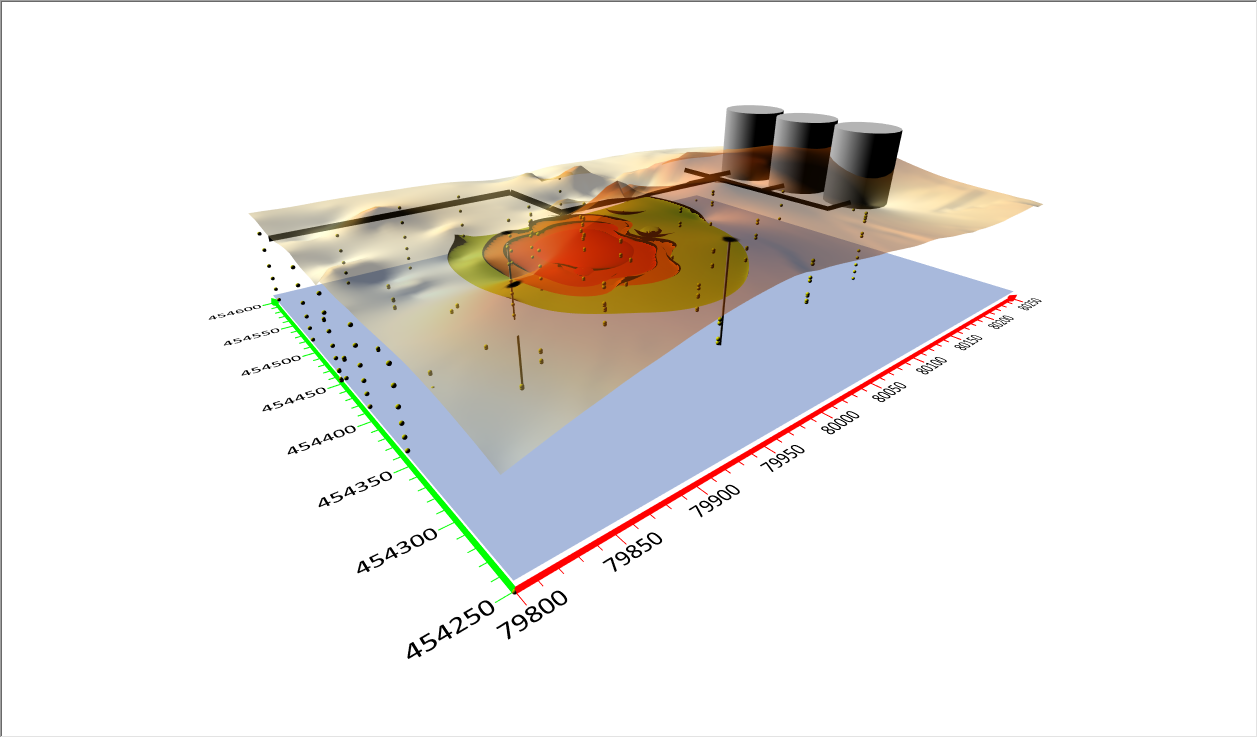
Tell the full story of your site
Are you looking for a way to clearly demonstrate the extent of contamination at a client site?
With Surfer, you can create a 3D conceptual site model that amplifies your years of experience and ensures you deliver a report that leaves a lasting impression on project stakeholders.
Fill out the form to gain access to the full webinar recording and data!
This webinar will cover the following topics, teaching you how to:
- Interpolate XYZC data to create a 3D grid
- Transform your 3D grid into a grid based map
- View slices of a 3D grid in the 2D plot view
- Visualize the 3D grid in the 3D view as a volume render, contours, and isosurfaces
- Combine map types to create a cohesive final report figure
- Export to 3D PDF and deliver a final output that impresses stakeholders